DOING MORE WITH LESS:
What the Built In Notts index reveals about the UK’s tech cities
By Martin Sandhu, Founder of Built in Notts
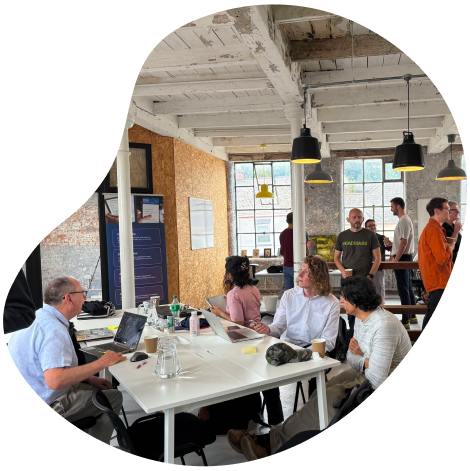
If you spend any time around the Nottingham tech scene, you’ll know the story already. A city full of people building things, often without the safety net of major funding rounds or government grants. You see it in co-working spaces, in university spin-outs, in the founders who still work a day job while they bootstrap their product.
That sense of creative graft is what inspired the Built in Notts Potential vs Investment Index. It’s not another vanity ranking or league table; it’s an attempt to put some data behind a question many of us have been asking for years: Are we getting our fair share of national tech investment?
To answer that, we compared more than 20 major UK cities across several dimensions including Innovate UK funding, the number of new technology businesses founded, graduate talent entering work and the survival rate of tech start-ups.
The idea was simple: measure inputs (how much funding and support goes in) against outputs (what’s actually being created).
Nottingham punches above its weight
At the top of the table sits Coventry, quietly outperforming other cities. Its combination of strong Innovate UK backing, a high number of businesses supported, and a well-developed innovation ecosystem gives it the highest overall score in the index. Cambridge follows – no surprise there – buoyed by deep R&D funding and decades of research-led infrastructure.
Then comes Sheffield, which demonstrates a well-balanced ecosystem. It isn’t the richest in funding, but it converts what it receives into real business creation and graduate retention. York performs impressively too, largely due to its extremely high per-capita Innovate UK funding.
“The idea was simple: measure inputs (how much funding and support goes in) against outputs (what’s actually being created).”
The next few places reveal something more interesting. Manchester recorded the highest number of new technology company formations in the entire dataset. Almost 800 new businesses in the last year alone. It’s a scale that reflects Manchester’s growing position as the North’s commercial engine. Yet its funding per capita is still moderate, showing that size doesn’t always mean proportionate national support.
Bristol and Belfast deserve attention for different reasons. Bristol’s strength lies in its stability; tech companies there are more likely to survive, giving it one of the best business-survival scores in the index. Belfast, meanwhile, is quietly building momentum, with low dissolution rates and gradually increasing public investment signals of a maturing ecosystem.
Nottingham
generated
new tech companies last year
Nottingham
produces
Total funding for
2024/25 was just over
one of the lowest levels
among the top ten cities
“Cities like Nottingham are producing a high number of startups, but not seeing equivalent public investment”
And then there’s Nottingham, sitting eighth overall. For some, that might sound modest; for those who know the landscape here, it’s a reflection of a city that punches above its weight. Nottingham generated 170 new tech companies last year and continues to produce more than 2,000 engineering and technology graduates entering work or further study. Yet its total Innovate UK funding for 2024/25 was just over £6 million, one of the lowest levels among the top ten cities. That imbalance between output and input is exactly what this index was designed to highlight.
The Built in Notts Top 20 - Potential vs Investment Index (2025)
|
City
|
Innovate UK funding per capita (2025)
|
Tech startup dissolution rate (2021 - 2025)
|
Annual engineering & Technology graduates
|
Overall
index
score
|
|---|---|---|---|---|
|
Coventry
|
£1,249.41
|
29.50%
|
1,615
|
260
|
|
Cambridge
|
£421.88
|
29.90%
|
825
|
236
|
|
Sheffield
|
£204.05
|
29.60%
|
2,585
|
211
|
|
York
|
£76.83
|
29.20%
|
||
|
Manchester
|
£26.18
|
30.80%
|
2,655
|
196
|
|
Bristol
|
£109.92
|
24.30%
|
1,825
|
190
|
|
Belfast
|
£106.90
|
24.20%
|
785
|
188
|
|
Nottingham
|
£70.84
|
27.10%
|
2,065
|
184
|
|
Oxford
|
£322.88
|
25.40%
|
675
|
177
|
|
Birmingham
|
£83.65
|
31.20%
|
1,775
|
162
|
|
Newcastle
|
£50.60
|
30.20%
|
1,525
|
156
|
|
Leeds
|
£17.17
|
27.20%
|
1,575
|
156
|
|
Glasgow
|
£102.82
|
26.50%
|
1,200
|
155
|
|
Liverpool
|
£60.90
|
30.30%
|
1,420
|
146
|
|
Southampton
|
£38.73
|
28.20%
|
1,135
|
142
|
|
Milton Keynes
|
£456.49
|
25.20%
|
30
|
139
|
|
Edinburgh
|
£31.75
|
30.90%
|
1,090
|
134
|
|
Leicester
|
£10.32
|
32.90%
|
570
|
106
|
|
Brighton
|
£10.15
|
66.10%
|
155
|
27
|
|
Cardiff
|
£19.98
|
77.50%
|
635
|
26
|
Why this matters
When you look at these rankings side by side, a pattern emerges: the distribution of national innovation funding doesn’t always correlate with where new businesses are being created. Cities like Nottingham are producing a high number of startups, but not seeing equivalent public investment. Conversely, smaller cities with strong research bases, like York and Cambridge, are attracting disproportionately high levels of Innovate UK funding per capita.
“visibility is what ultimately drives change.”
The purpose here isn’t to complain about funding disparities. It’s to make them visible. Because visibility is what ultimately drives change. Investors, policymakers and founders all make decisions based on perceived opportunity. If the data shows that cities like Nottingham can convert limited inputs into strong outputs, it strengthens the case for backing them more heavily.
How the index was created
To ensure transparency, the Built in Notts Potential vs Investment Index was built entirely on publicly available data. Figures were drawn from three main sources:
- Innovate UK for total technology funding awarded and the number of businesses supported in 2023/24 and 2024/25.
- Companies House for the number of new technology businesses (SIC code 62020 – Information Technology Consultancy Activities) founded each year between 2021 and 2025, and the percentage dissolved in that period.
- HESA (Higher Education Statistics Agency) for the number of engineering and technology graduates entering employment or further study from universities in each city.
Each dataset was normalised into a 0–100 index to allow cities of different sizes to be compared fairly. Cities were then ranked based on their combined performance across funding, startup activity and talent output. The aim wasn’t to create competition, but context and a data-backed view of where investment is landing, and where potential is being created without it.
“Nottingham has always had the brains and the drive, but what it hasn’t always had is the same access to funding and networks that bigger cities enjoy. This research shows what many of us already know – the potential is here, it just needs backing at the same scale.”
Jordan Adams
How nottingham fits in
Nottingham’s results echo what many local founders already know: this is a city built on resilience. It doesn’t have the cluster of accelerators or corporate R&D budgets that cities like Cambridge enjoy. But it does have world-class universities, a fast-growing digital health and fintech sector, and a startup community that tends to collaborate rather than compete.
The index gives that story numbers. Nottingham’s high startup and graduate indices show clear momentum. Its low Innovate UK funding index (just 7.16 for 2024/25) highlights the gap that needs closing. The city isn’t waiting for permission, but if funding started to match the level of activity already happening here, the return on that investment could be huge.
What built in notts is doing next
Built in Notts isn’t just a research project – it’s becoming a focal
point for the city’s tech community.
Over the coming months, we’ll be:
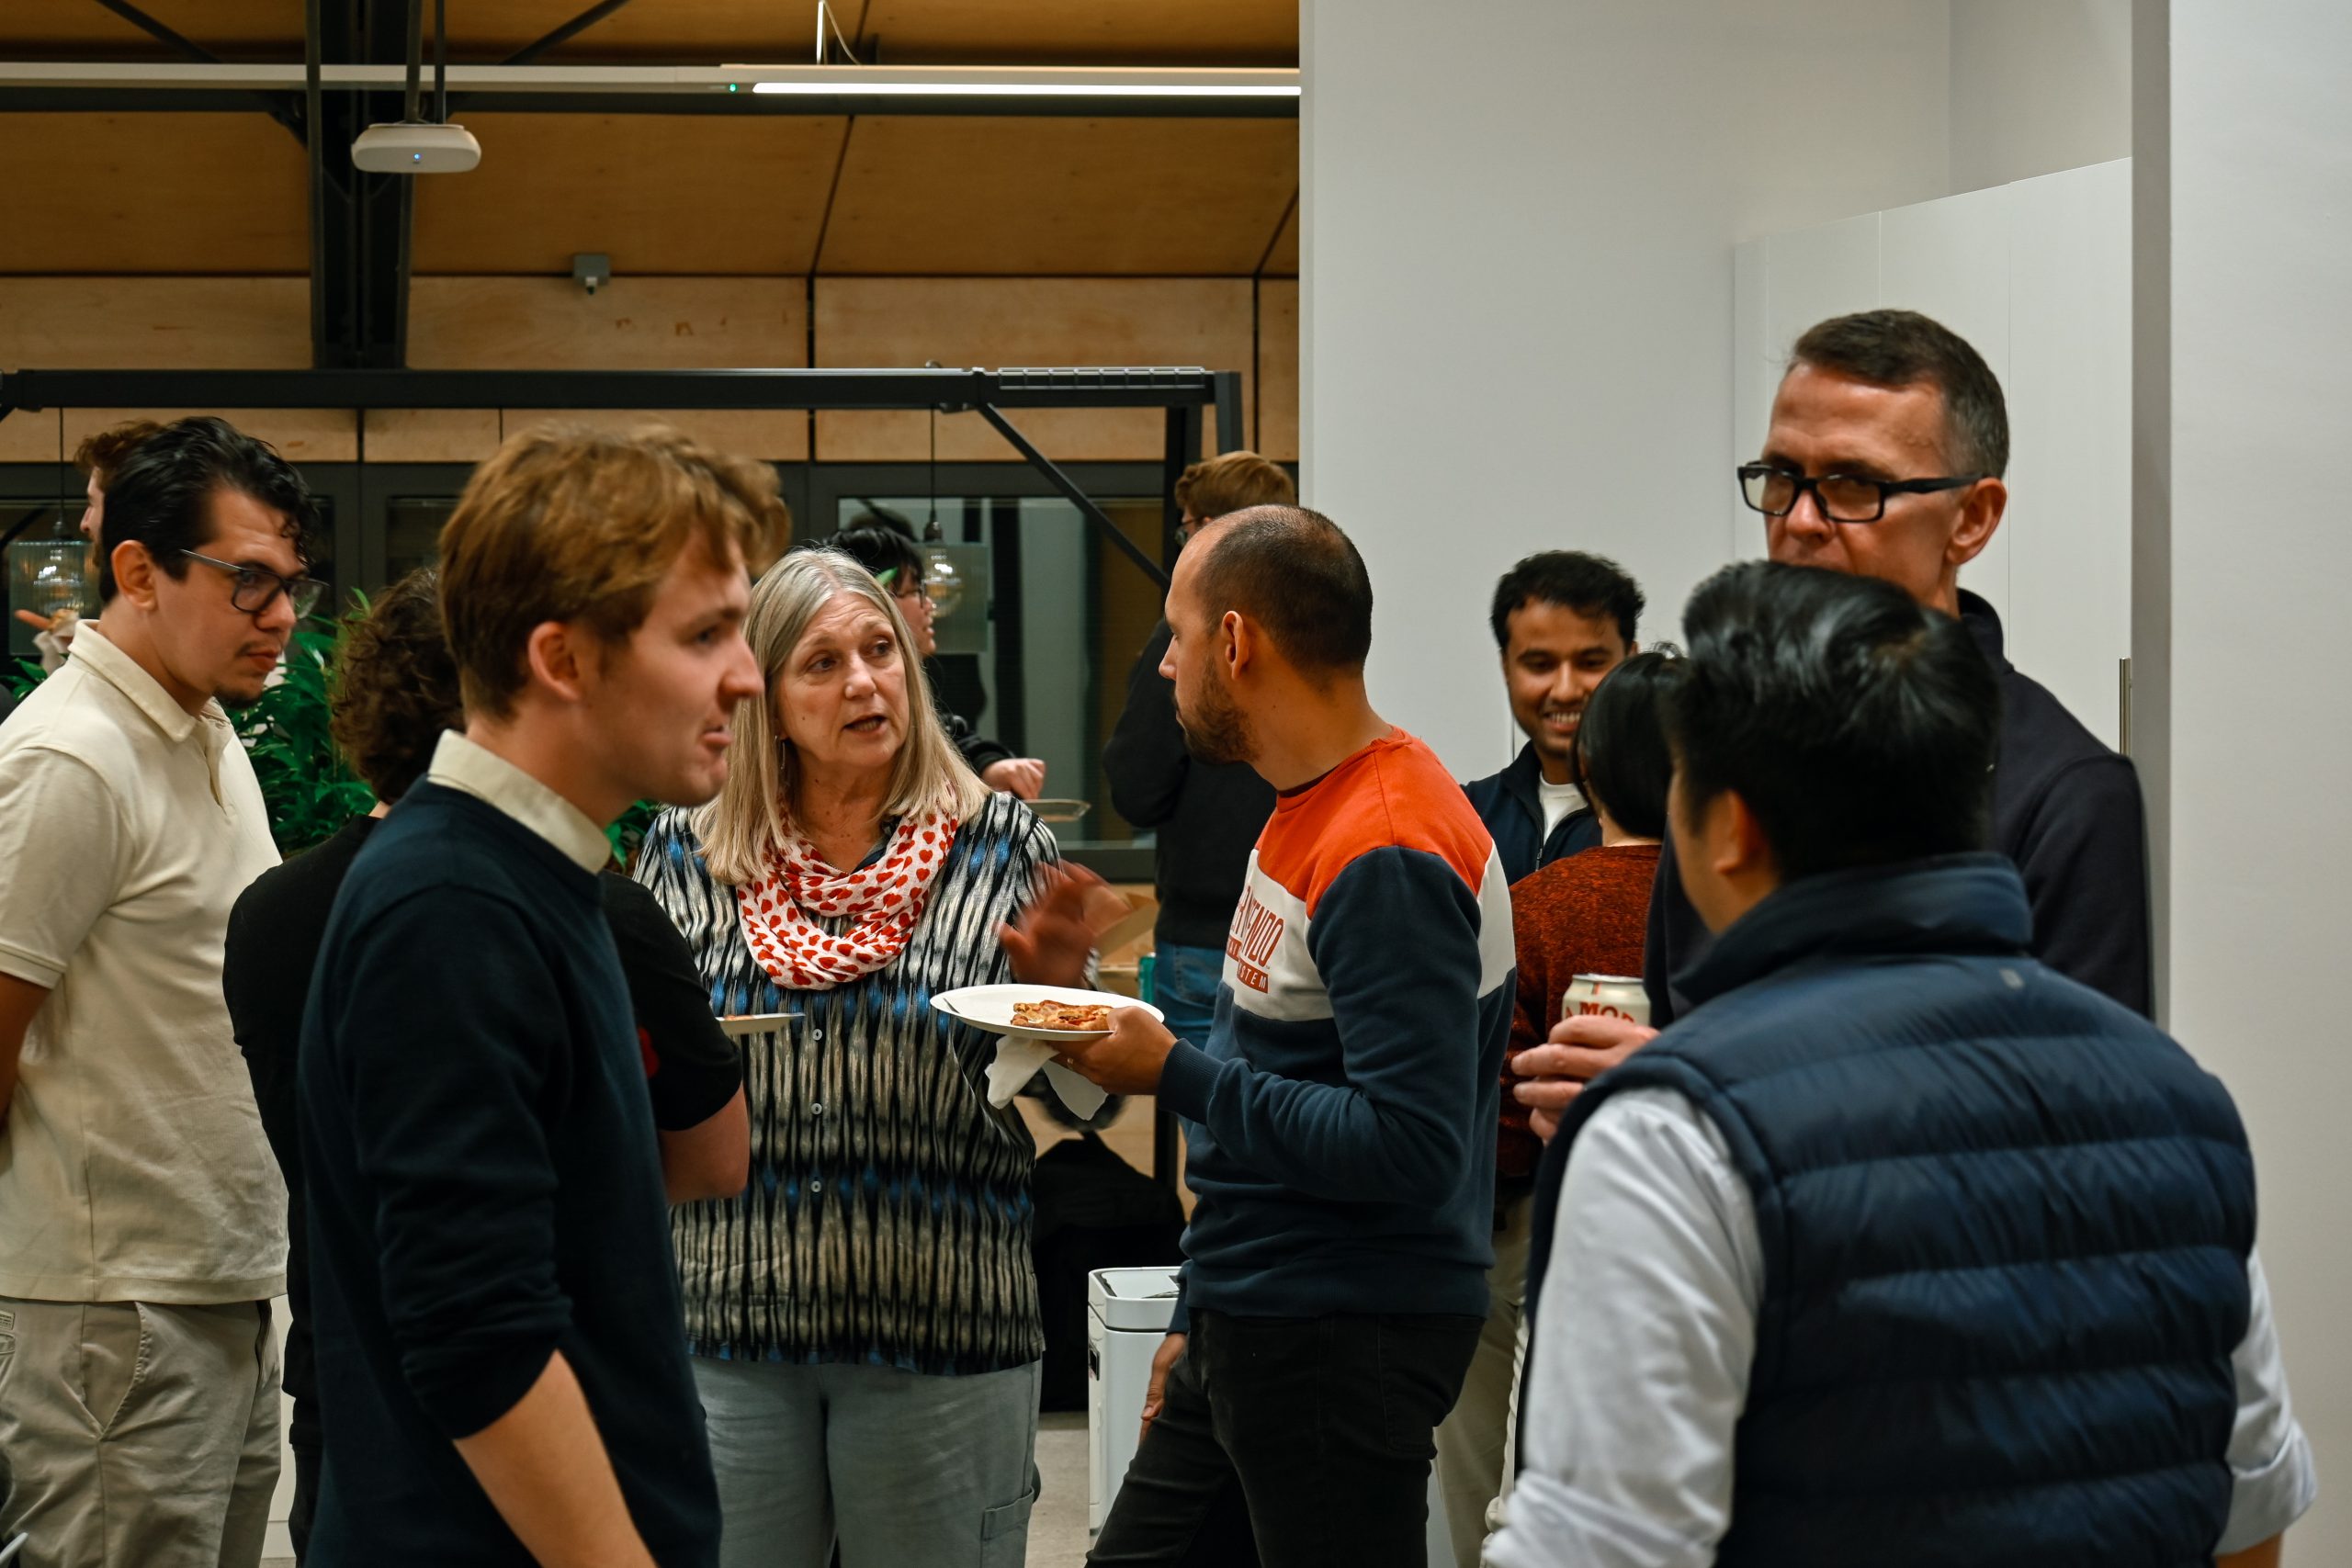
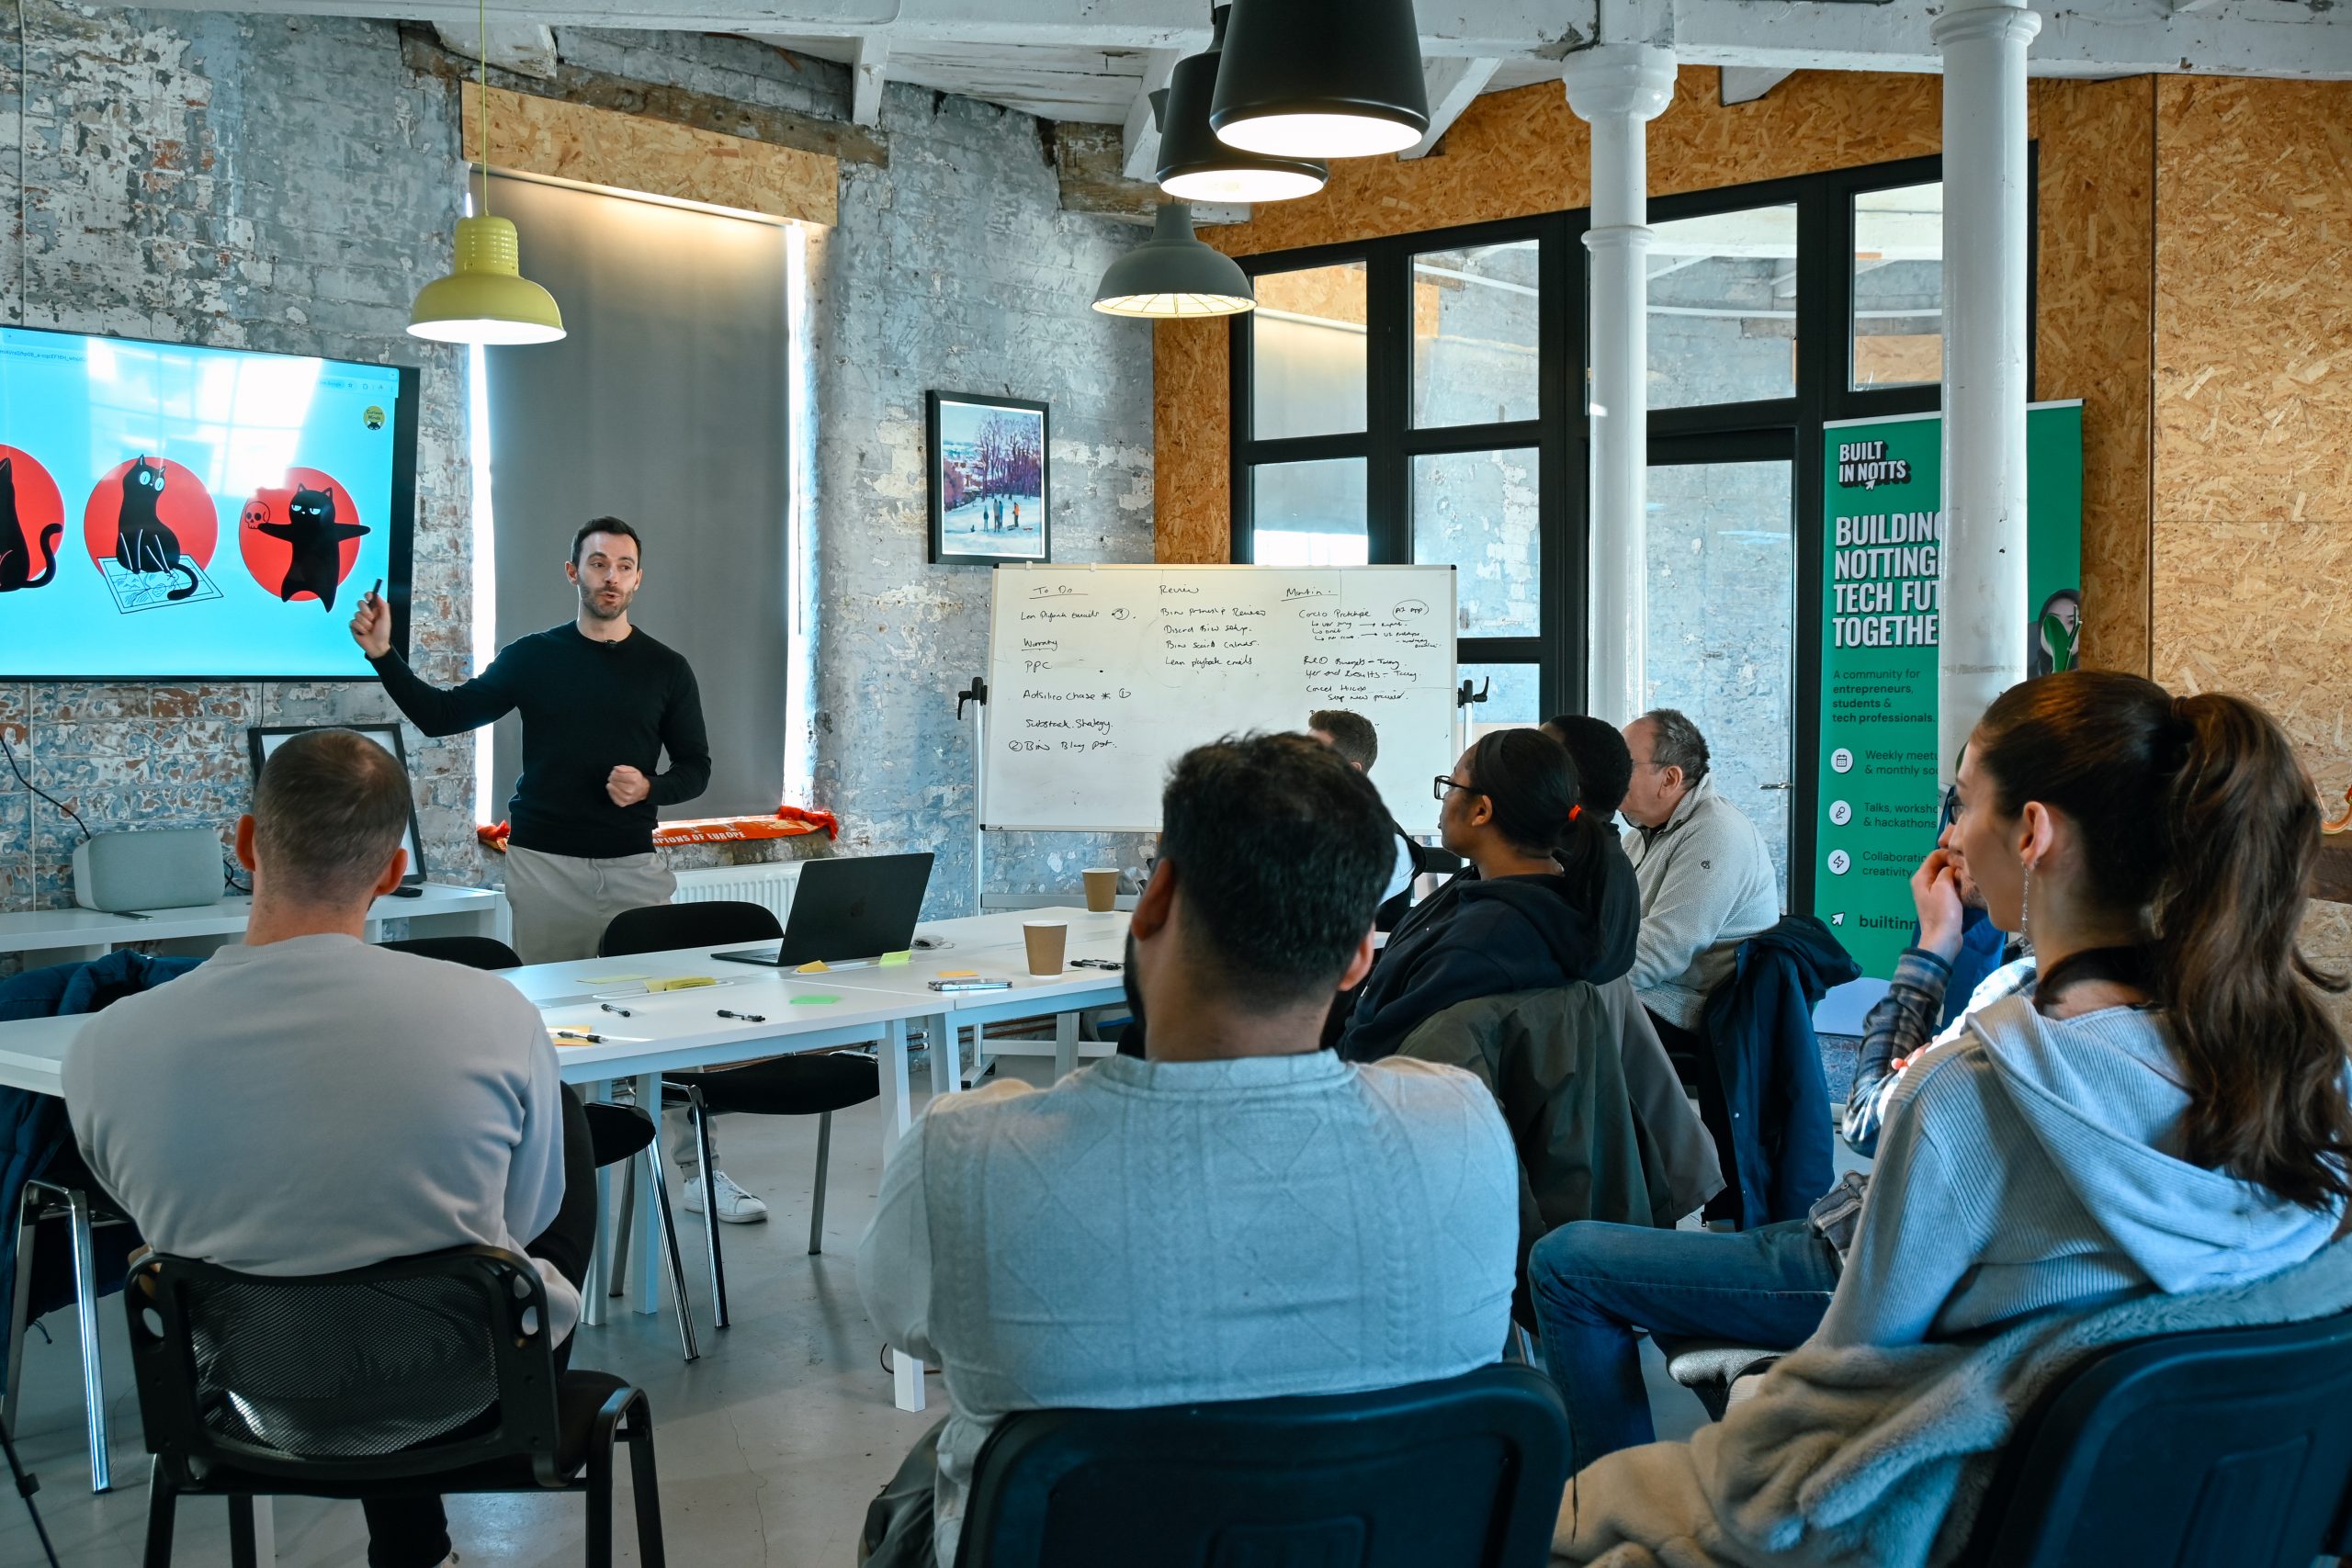
Hosting meetups and panels
where founders, investors and policymakers can connect directly.
Building an online community hub to share opportunities, funding alerts and local success stories.
Partnering with universities and innovation networks to link investors with emerging tech talent and spinouts.
Publishing further research to map Nottingham’s growth trajectory in more detail.
The goal is to give investors a genuine centre of gravity. Somewhere to start, connect and build relationships. Nottingham has the energy and the ideas; Built in Notts aims to give it the visibility and structure to match.
As someone who’s built a company here, that feels both validating
and motivating. Because when you strip away the numbers, what
this index really measures is belief – belief that great things
can start anywhere, and that it’s worth investing in the people
who make them happen.
What’s coming up
Built in Notts hosts meetups, networking events and workshops to help founders connect, share knowledge and grow.

Weekly Tech Meetup | 2026 Community Roundtable
- January 14, 2026
Built in Notts January Social
- January 15, 2026
Weekly Tech Meetup
- January 21, 2026
Weekly Tech Meetup
- January 21, 2026
Built in Notts January Social
- January 15, 2026
Weekly Tech Meetup | 2026 Community Roundtable
- January 14, 2026